How to Teach Fractions: 4 Strategies for Student Success
Knowing how to teach fractions can make all the difference for student mastery. Follow these tips to build your students’ conceptual understanding.
It’s no secret that fractions can be a great hurdle for many students. And textbooks and online platforms now use fraction visual models to help overcome that hurdle.
So why do so many students still struggle? If fraction visual models are so effective, shouldn’t fraction frustration be a distant memory by now?
The answer is that it’s complicated. Sure, visual representations can offer tremendous benefit to our students. And not just for fractions. But they’re not a magic cure all.
In order for visual models to serve their purpose, we need to choose the right model, at the right time. And we need to see models as a vehicle to understanding, not just another item in the curriculum.
After making every possible mistake in my own classroom, I’ve figured out what works and what doesn’t. So if you’re not sure how to teach your fraction visual models, don’t fret.
Just follow the five tips below, and check out the recommended resources, to make fraction visual models a breeze for you and your students.
A few years ago, I began coaching “Mr. Abbott,” a middle school math teacher. His students had recently cruised through their expressions and equations unit. But instead of celebrating, he was concerned.
“As soon as I introduced fractions into the equations, they were lost.” I figured that visual models could help clear things up, and we met to plan a demo lesson.
“But my students don’t need fraction visual models. They did that in elementary. We’re already on equations.”
Mr. Abbott explained that his students had no trouble with the visual models in their textbook and on the benchmark tests. He felt they needed more practice with equations. But I wanted to take a closer look.
So we planned a lesson on equation proofs, but started with a round of Secret Whiteboard, a warmup game. It starts with everyone standing, and I announce a question. They have five seconds to respond on their whiteboards. When I finish counting down, they hold their boards up. If they’re right, they remain standing. Otherwise, they can continue to play from their seats.
I use this often when I’m teaching a new group of students. It helps me get a quick read on where students are, without a formal formative assessment.
I began with, “What is ½ plus ½?” Most of the students got this one right.
Next, I asked them to draw a visual model of ⅗. They looked at each other, confused. Only about half of them drew anything. And only around 10% actually drew a model of ⅗.
Mr. Abbott was in shock. “How could they not know this? They’ve been working with fractions all year.”
Now, I’m not trying to trash Mr. Abbott. He didn’t really do anything wrong. In fact, I’ve gone through this process dozens of times, with different teachers, and almost always get the same result.
For some reason, students everywhere have a hard time drawing fraction visual models. And many teachers are unaware of the issue. Fewer still know how to fix it.
Research shows that fraction visual models are incredibly effective for teaching fraction concepts.
Conceptual understanding means knowing the meaning of a numerators and a denominators. As well as understanding what actually happens when we perform fraction operations. Knowing why the algorithms work, as opposed to just getting answers.
Without conceptual understanding, students can’t use what they know to solve word problems, or apply their understanding in real-world situations.
Many students learn to calculate with fractions, but most never developing conceptual understanding. Some educators believe that a procedural approach is good enough — “I didn’t learn about fraction visual models in school, and I turned out fine!”
But a number of studies highlight the disappointing results of the “old school” approach. For one, American students consistently perform poorly on international math assessments. Many of us continue to struggle with fractions through college and into adulthood.
In addition to their instructional benefits, fraction visual models also make effective assessments. As in my Secret Whiteboard example, when students draw a fraction visual model, you can instantly tell whether or not they have understand the concept. This isn’t always clear when they’re just calculating.
But many textbooks make fraction visual models more complex and confusing than they have to be. And there is not enough emphasis on having students draw models – instead, they mostly just interpret the models printed in the books.
As a result, they don’t get the full benefits of using visual models. And teachers don’t get to see what’s really going on in their students’ heads.
One of the biggest challenges in using fraction visual models is teacher confidence. When I started teaching math, the last thing I wanted to do was stand in front of my class and draw a visual model.
I couldn’t tell an array from an area model. And I wasn’t about to learn with my students watching. So I did a little reading, and I practiced a bit after school.
My first models were still quite lopsided. I had to keep my dry-erase cloth nearby, or I’d end up with blue smudges all over my hands. And it took a few weeks for my students to catch on. But soon, I started seeing significant improvements.
Students made fewer sloppy errors. And they started explaining their answers to me and to each other. They were able to learn new content more quickly, and they were less likely to forget what they’d already learned.
Over the years, I refined my approach, making it easier for students to adjust to the “new way” of thinking about fractions. And to ensure the visual representations led to meaningful learning.
And I realized these five habits were key to helping my students get the most out of fractions visual models.
When it comes to developing numeracy, the best visual models are scale models.
A scale model is one that accurately represents the size of the number. So a scale model of ⅔ is the same size as a model of 4/6. And a scale model of ⅔ is twice as big as a scale model of ⅓.
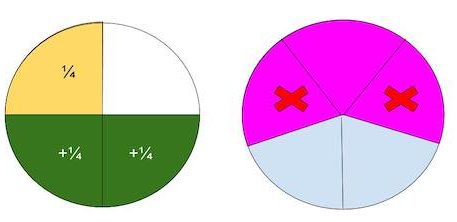
A good scale model also represents the meaning of the operations involved. So a scale model of addition shows two values being combined, while a scale model of division shows a number being split into equal parts.
When drawing fraction visual models for your students, don’t stress that models are exactly proportional (that’s impossible). But they should look as if they’re cut into equal parts. And a visual model of ⅓ x ¼ shouldn’t just be a model of 1/12. Demonstrate what is happening when we multiply a fraction by a fraction.
Set these expectations for students as well. If they find it hard to draw shapes cut into equal parts, try using technology or graph paper.
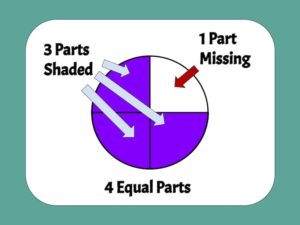
The essence of understanding fractions comes down to numerators and denominators.
The denominator cuts a whole into equal parts. The numerator counts those parts. Students first learn to understand fractions as parts of a whole.
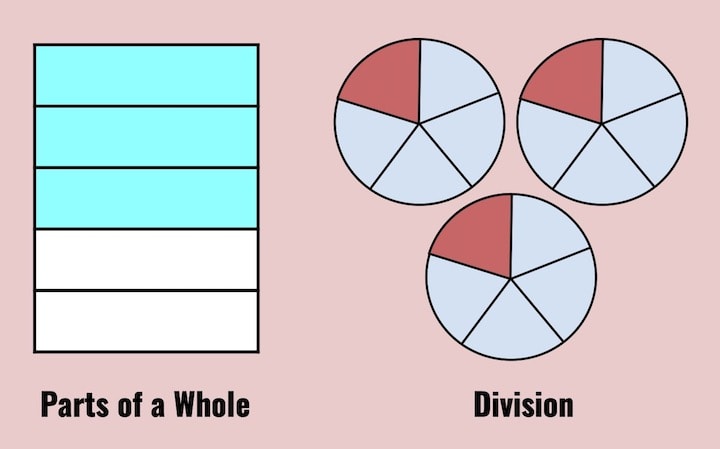
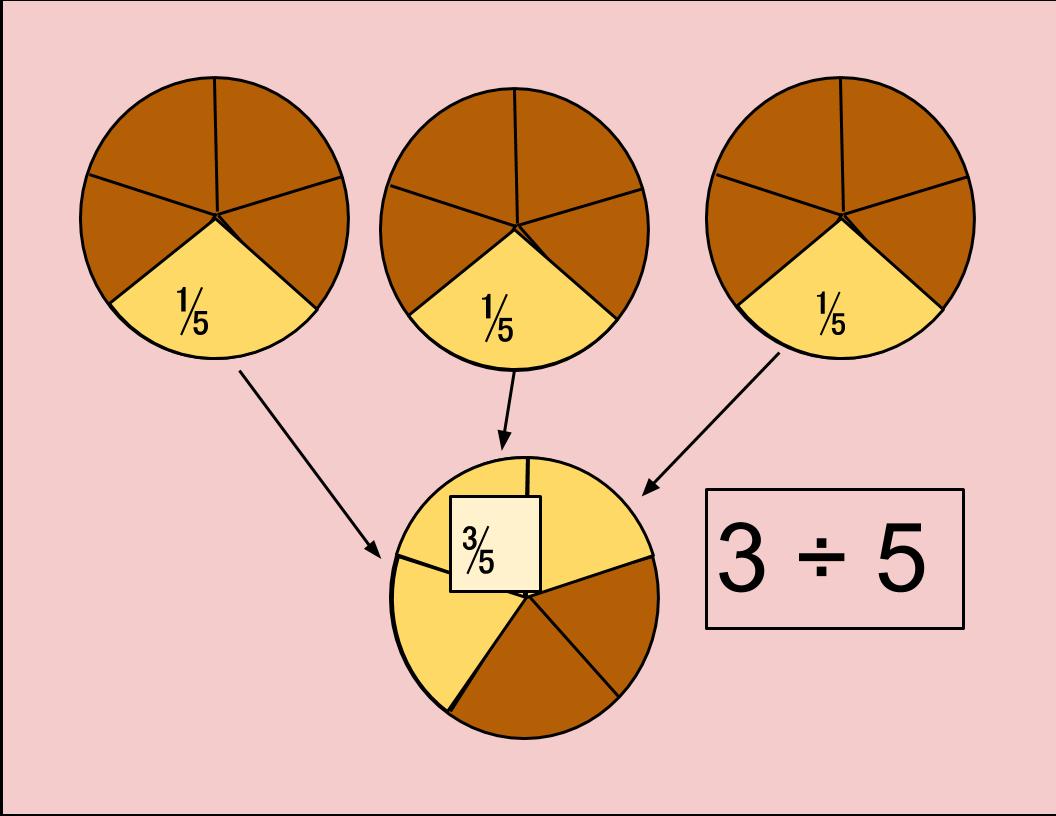
Later, students are introduced to the idea of fractions as division. The fraction ¼ is the same as 1 divided by 4. Students should be able to model both meanings of fractions before moving on to fraction operations.
But many students are expected to work with models of fraction operations or equivalence before they’ve mastered the basics.
Whether you’re teaching 2nd grade or 22nd grade, do yourself a favor and take a minute to review numerators and denominators with your students.
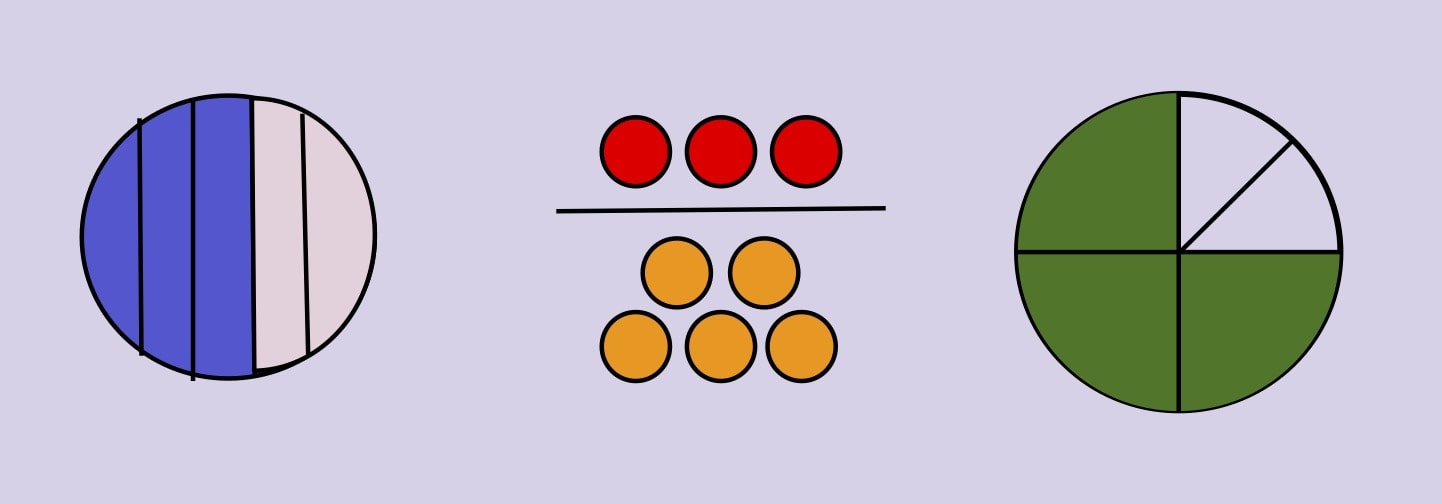
It’s also important for students to understand simpler visual models before using advanced ones. The typical progression for modeling fractions starts with circular (pie models) and extends to rectangular area models. Next, students can move on to more complex representations, like number lines and bar models.
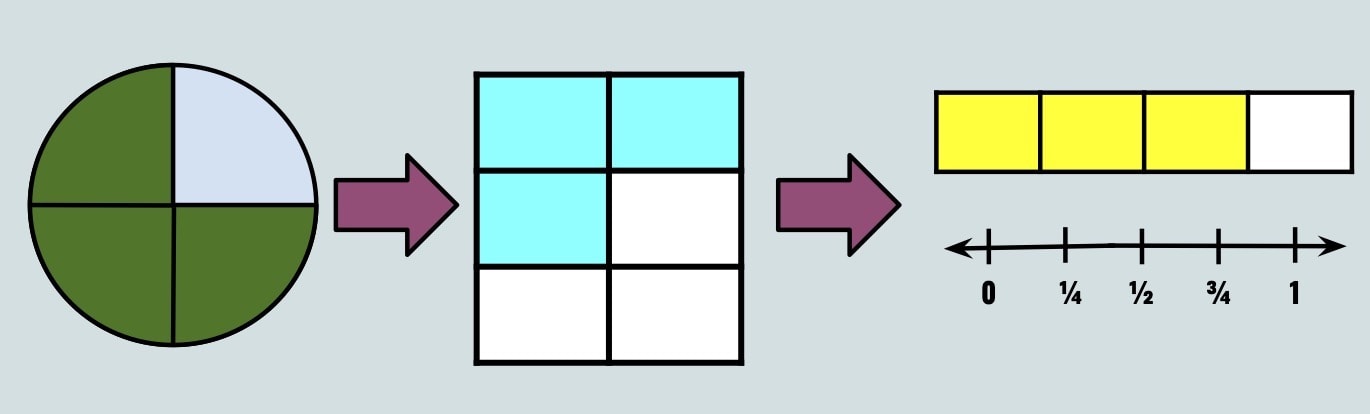
Skipping a step in the progression is a common cause of confusion. Number lines and bar models are still representative (scale) models. But they’re more abstract than the circular and rectangular models, which show a fraction’s size in two-dimensions. I see this issue a lot with middle school students who struggle with bar models – most never became fluent with arrays, area models, and number lines.
This issue also affects teachers. Most of us don’t have the chance to learn content from prior grade levels. So if your 6th grade text is using bar models to demonstrate proportions, and you never taught 3rd grade, you might never have been exposed to arrays and area models.
Whether you’re teaching the meaning of fractions or fraction operations, visual models can help students connect fractions to what they already know.
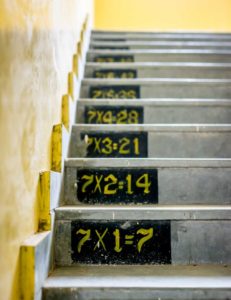
Division is an essential foundation for fractions. Once students can divide objects into equal groups, they can begin to grasp dividing a whole into equal parts.
But understanding division starts with understanding multiplication. So if students have a hard time modeling division, have them create arrays and area models. Then, they can work backward to “divide” the multiplication models they create.
Once students can represent fractions visually, they can also use models to figure out new concepts.
This is the essence of inquiry-based learning. If we teach students to think of visual models as a tool for learning, they can begin discovering connections on their own. Or in collaborative groups.
A student who understands the meaning of ⅕, and the meaning of addition, can easily create a model of ⅕ + ⅕. Without explicitly teaching them how to add fractions, they can arrive at understanding.
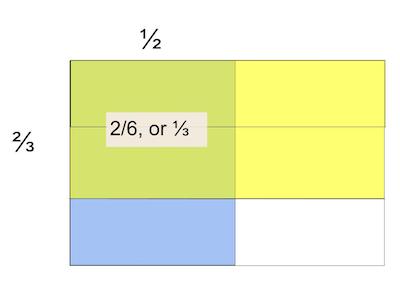
And if they understand multiplication as repeated addition, they can also figure out how to find ⅕ x 2, or ⅕ x 3. This can then be extended to multiply a fraction by a fraction with an area model.
My most effective fraction lessons involved very little direct instruction. Instead, they involved problem-solving that took students just past the edge of their understanding.
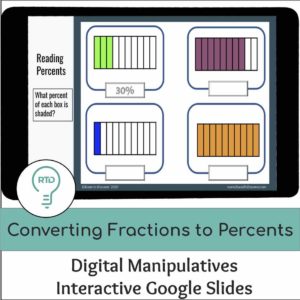
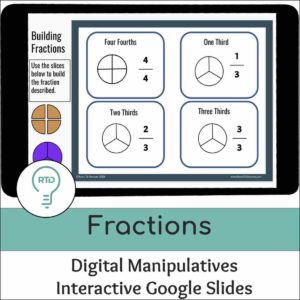
I’ve turned a number of these lessons into interactive Google Slides, which you can download from our online store. There are inquiry-based activities on fraction foundations, fractional quotients, multiplying fractions, and more.
This one may seem obvious, but I’m amazed to find how many students have never drawn a fraction visual model. Even students using textbooks rich in visual models spend most of their time interpreting models rather than drawing them.
It’s understandable that the making of models is underrepresented. A question like “which expression matches the visual model?” is easy to correct. But it’s hard to assess student-drawn models. You can’t put the right answer in the teacher’s edition, as every student’s model will look a bit different.
And as hard as it is for teachers to assess student-created models, it’s virtually impossible for a digital platform. Even the good ones are designed mostly for multiple choice and matching. That’s one reason I like to use Google Slides with embedded manipulatives. Students can work on these independently or in small (breakout) groups. Just add to a Google Classroom assignment, and “Make a Copy for Each Student.”
Another reason for avoiding student-created models is motivation. It’s hard enough to get students to show their work or explain their answers. Creating models requires a great deal of effort and creativity. Especially if they don’t have much experience.
But despite the challenges, it’s critical to have students create their own models. Imagine trying to learn Spanish by watching Telemundo. You might learn to follow along. But without actually speaking and writing in Spanish, you’ll never become fluent. The same is true for students who don’t draw their own fraction visual models.
It took consistency to establish visual models as a norm in my classes. I assigned them for classwork, homework, and on projects. A significant part of every test and quiz required students to create their own visual models.
Eventually, they understood that modeling was just as important as answer-getting. And they knew they couldn’t opt out of drawing models…at least if they wanted to pass. Once they got in the habit of creating models, they steadily improved through practice.
If you can focus on these five strategies, your students’ fraction fluency will grow in no time.
Even if you already feel confident teaching fraction visual models, you still need the right resources. And if your textbook doesn’t create opportunities for deep, meaningful learning, you’ll want to check out the lessons and activities in our online store. Even if you have a great curriculum, you’ll find supplemental tasks to challenge and support learners at every level.
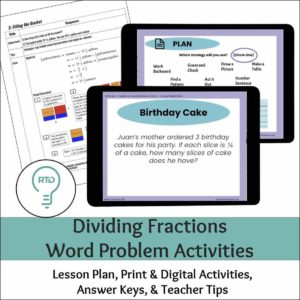
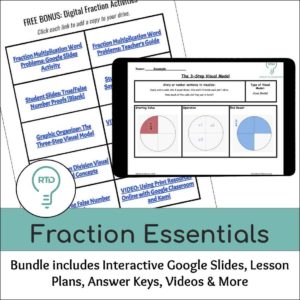
You can even download an entire treasure trove of activities, to cover all the foundational fraction topics. Just check out our Fractions Essentials Bundle. It has everything you’ll need: lesson plans, digital activities, printable .pdf’s, and helpful teaching tips. Your students will love learning about fractions through visual models, word problems, and number sentence proofs.
Get Your Copy of FRACTION ESSENTIALS
To take your visual model chops to the next level enroll in an Online Educator Workshop. These aren’t video courses: every session is conducted in real time, and facilitated by an expert math educator. You’ll engage in collaborative activities with fellow educators, as you learn all there is to know about teaching visual models.
We offer separate sessions for Grades K-5 and for Grade 6 through Algebra I. You’ll learn best practices for teaching and assessing visual models, as well as how to create powerful, collaborative, inquiry-based learning experiences in your classroom.
 Jeff Lisciandrello is the founder of Room to Discover and an education consultant specializing in student-centered learning. His 3-Bridges Design for Learning helps schools explore innovative practices within traditional settings. He enjoys helping educators embrace inquiry-based and personalized approaches to instruction. You can connect with him via Twitter @EdTechJeff
Knowing how to teach fractions can make all the difference for student mastery. Follow these tips to build your students’ conceptual understanding.

Many educators are starting to recognize the problem with homework. And while homework is almost universal, there is little evidence that it actually works.
Essential reading for every math teacher! The meanings of multiplication support student engagement, conceptual understanding, and success with word problems.